체위성 폐쇄성 수면무호흡 환자의 임상적 특징: 성향점수 매칭 분석
Obstructive Sleep Apnea According to Positional Dependency: Propensity Score Matching Analysis
Article information
Trans Abstract
Background and Objectives
Obstructive sleep apnea (OSA) patients can be classified into two groups based on the relationship between their supine and non-supine apnea-hypopnea index (AHI). This study compared the clinical characteristics of positional and non-positional OSA patients and identified factors influencing OSA severity in each group.
Subjects and Method
The positional OSA group consisted of patients with a supine AHI more than twice the value of the non-supine AHI. Propensity-score matching (PSM) was performed to balance AHI differences between the groups. Demographic data, symptom scores, physical examination results, and polysomnography (PSG) data were analyzed. Compliance data for patients using auto-adjusting positive airway pressure (APAP) were also collected.
Results
Ninty patients in each group were matched through PSM. The non-positional OSA group exhibited significantly higher daytime sleepiness scores (p=0.040). There were no significant differences in sex, age, body mass index (BMI), or physical examination results. On the other hand, the PSG data of positional OSA group showed significantly higher average (p=0.031) and as well as lowest oxygen saturation (p=0.046). BMI was a risk factor for severe OSA in both groups, with age being significant in the positional group and sex and retropalatal obstruction in the non-positional group. Although non-positional patients utilized APAP more frequently than the positional group, there were no significant differences in compliance.
Conclusion
Positional dependency in OSA patients is associated with varying symptom severity, the PSG findings and PAP usage. Factors like BMI, age, sex, and the level of obstruction in severe OSA differed depending on positional dependency.
Introduction
Obstructive sleep apnea (OSA) is a common sleep disorder characterized by recurrent upper airway blockages, leading to reduced oxygen levels and disrupted sleep patterns [1]. Approximately 1 billion individuals aged 30 to 69 worldwide are estimated to be affected by OSA [2]. Risk factors for OSA include male sex, obesity, aging, menopause, and impairments in upper airway anatomy or muscle function [3,4]. The exact cause of OSA is not fully understood, but it is believed to result from upper airway obstruction due to negative pressure collapse during inspiration and gradual narrowing in the retro-palatal area during exhalation [5]. Symptoms commonly exhibited by patients with OSA include snoring, gasping for air during sleep, daytime sleepiness, morning headaches, and cognitive impairment [6].
The clinical presentation and severity of OSA can vary among individuals due to differences in OSA-related parameters, as well as variations in the duration and type of sleep. A significant distinction in OSA lies in the relationship between the supine apnea-hypopnea index (AHI) and the non-supine AHI, categorizing patients into positional and nonpositional OSA groups. Positional dependent OSA was first described by Cartwright, et al. [7] in 1991, identifying patients with a supine AHI more than twice their non-supine AHI as having positional dependent OSA. This categorization, based on the propensity for apneic events to occur in supine versus non-supine sleeping positions, is clinically significant and carries implications for diagnostic, therapeutic, and prognostic considerations [8,9]. Oksenberg, et al. [8] found that OSA patients who experience more severe apneic events in the supine position may benefit from positional therapy, which encourages sleeping in a non-supine position. Additionally, an inverse relationship between body mass index (BMI) and positional dependency suggests that weight loss may be beneficial for individuals with non-positional dependency [9].
Although the differentiation between positional and non-positional OSA is increasingly recognized, comprehensive investigations into the disparities between these groups are imperative. This study aims to identify differences in the clinical features of positional dependent OSA and analyze treatment methods based on positional dependency.
Subjects and Methods
Study population and data collection
We selected patients through a retrospective chart review who had undergone level 1 polysomnography (PSG) and were diagnosed with OSA. OSA was defined as having an AHI of 5 or greater. The inclusion criteria encompassed adult patients aged 18 years and older with full-night level 1 PSG data, a total sleep time of more than 4 hours, and at least 30 minutes of sleep in both the supine and non-supine positions.
This study received approval from the Institutional Review Board of Hanyang University Guri Hospital, South Korea (GURI 2023-08-020) and adhered to the principles outlined in the Declaration of Helsinki and good clinical practice guidelines.
Study design
Positional OSA was defined as having a supine AHI more than twice the non-supine AHI. We obtained demographic and clinical information through retrospective chart reviews and compared each variable between the two groups. The demographic data collected included age, sex, BMI, and underlying diseases. During the first outpatient clinic visit, we measured neck/waist/hip circumferences and evaluated nasal septal deviation status, tonsil size, and oropharynx using the Mallampati score [10] and assessed the upper airway through the Muller maneuver [11]. Patients’ subjective symptoms were evaluated using the Epworth Sleepiness Scale (ESS) [12,13].
The PSG was performed under the supervision of a polysomnographic technician using the Nox A1 PSG System (Nox Medical, Reykjavik, Iceland). The Nox A1 PSG recorder captured a 3-axis gravity signal within the range of -1 to 1 times Earth’s gravity (g). The x-axis was aligned through the chest, the y-axis extended from shoulder to shoulder, and the z-axis ran from the feet to the head. The rotation angle was derived from the arctangent of the y and x values. Body positions were classified as follows: the supine position was indicated by an angle of 0°, within a range of -45° to 45°; the prone position at ±180°, within a range of -135° to -180° and from 135° to 180°; and the lateral positions, with the right lateral from -135° to -45°, and the left lateral from 45° to 135°.
PSG data collected included total sleep time (TST), sleep latency, wakefulness after sleep onset (WASO), sleep efficiency, snoring percentage, total AHI, supine AHI, non-supine AHI, periodic limb movements of sleep, average percutaneous oxygen saturation (SpO2), minimal SpO2, T90 (the proportion of TST with SpO2 falling below 90%), and the percentage of each sleep stage (N1, N2, N3, rapid eye movement).
Furthermore, we analyzed auto-adjusting positive airway pressure (APAP) usage data from patients who used APAP after PSG. This analysis included the average proportion of days used, the average proportion of days with usage exceeding 4 hours, and APAP compliance. Compliance was defined as patients using APAP for more than 4 hours a day on more than 70% of the total usage days during a 3-month period.
Statistical analysis
Propensity-score matching (PSM) was performed to resolve the selection bias arising from differences in the number of patients and AHI between the positional and non-positional OSA groups. The PSM analysis was conducted using R software (version 4.3.2; R Development Core Team, Vienna, Austria). The propensity scores were estimated using logistic regression analysis, and the matching method employed was n:1 nearest neighbor matching. We adjusted the caliper so that the absolute value of the standardized difference of the mean was less than 10%. Using PSM, the AHI was matched at a 1:1 ratio.
Statistical analyses were conducted using SPSS version 28.0 software (IBM Corp., Armonk, NY, USA). The χ2 test and independent t-test were used to compare variables between the two groups. We analyzed the factors that significantly affect AHI and OSA severity using correlation tests and logistic regression analysis. A p-value of less than 0.05 was considered statistically significant.
Results
PSM
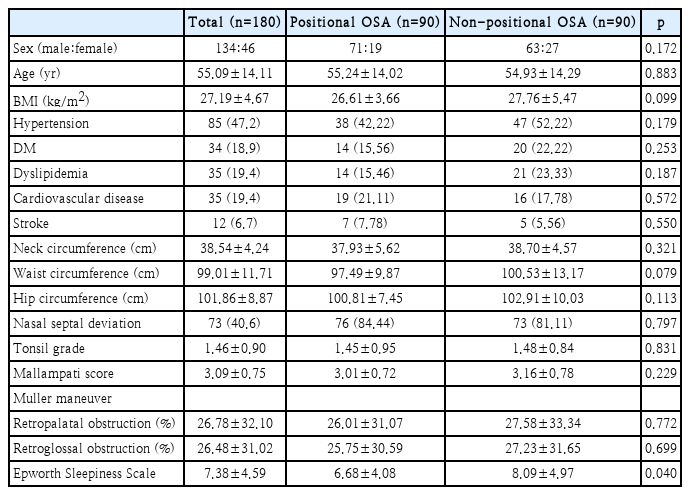
A total of 558 patients were diagnosed with OSA. Among them, 428 patients (76.70%) were classified as having positional OSA, and 130 patients (23.30%) were classified as having non-positional OSA. The average AHI for the positional OSA group was 28.47±16.56/hr, while for the non-positional group it was 56.04±29.83/hr. To address the significant differences in AHI values and the unequal group sizes, we conducted PSM to mitigate potential bias. After PSM, each group consisted of 90 patients, balanced with AHI matching criteria (p<0.001 to p=0.679) (Table 1).
Differences in clinical features and PSG study results
In terms of patient characteristics, no notable differences were observed between the positional and non-positional OSA groups (Table 2). There were no significant differences in BMI, neck circumference, waist circumference, or hip circumference between the two groups. Additionally, tonsil grade, Mallampati score, and Muller maneuver values were also similar between the two groups with no significant differences. While demographics and physical examination results did not show significant differences between the two groups, there was a notable difference in subjective symptoms. Participants with non-positional OSA had a significantly higher ESS score of 8.09±4.97 compared to those with positional OSA, who had a score of 6.68±4.08 (p=0.040).
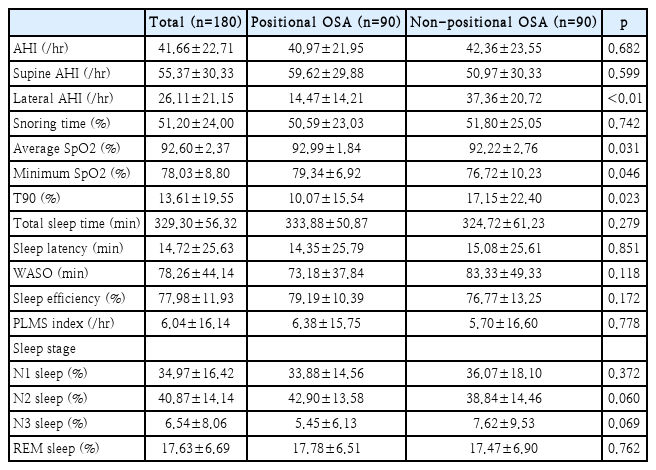
The analyzed PSG data between the two groups are described in Table 3. The positional OSA group exhibited significantly higher average SpO2 levels (p=0.031) and higher minimum SpO2 levels (p=0.046) during sleep compared to non-positional OSA. The positional OSA group also had a significantly lower proportion of sleep time with SpO2 falling below 90% (T90, p=0.023). Regarding other PSG variables and sleep stage distribution, there were no significant differences between the two groups.
Comparison of factors associated with OSA severity
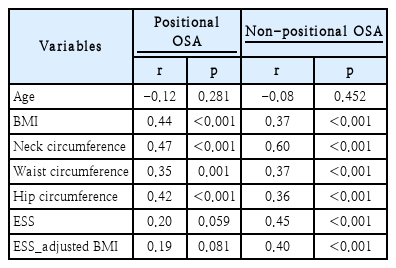
We analyzed the risk factors that could influence the severity of OSA between the two groups. Firstly, we conducted a Pearson correlation analysis to identify the variables related to AHI (Table 4). Age did not exhibit a significant correlation with AHI in either group. On the other hand, BMI displayed a statistically significant positive correlation in both groups (p<0.001). Additionally, measurements such as neck circumference, waist circumference, and hip circumference all exhibited significant correlations. Notably, the subjective symptoms expressed as ESS showed different patterns for the two groups. In the non-positional OSA group, as AHI increased, there was a significant worsening of symptoms (p<0.001). However, in the positional OSA group, this correlation was not statistically significant (p=0.059). We further conducted correlation tests with BMI as a controlled variable. After adjusting for BMI, the relationship between AHI and symptom severity remained statistically significant only in the nonpositional group (p<0.001). Therefore, in the non-positional OSA group, as patients complained of severe symptoms, the likelihood of having a higher AHI value increased. The summary of the correlation test is also presented in Fig. 1.
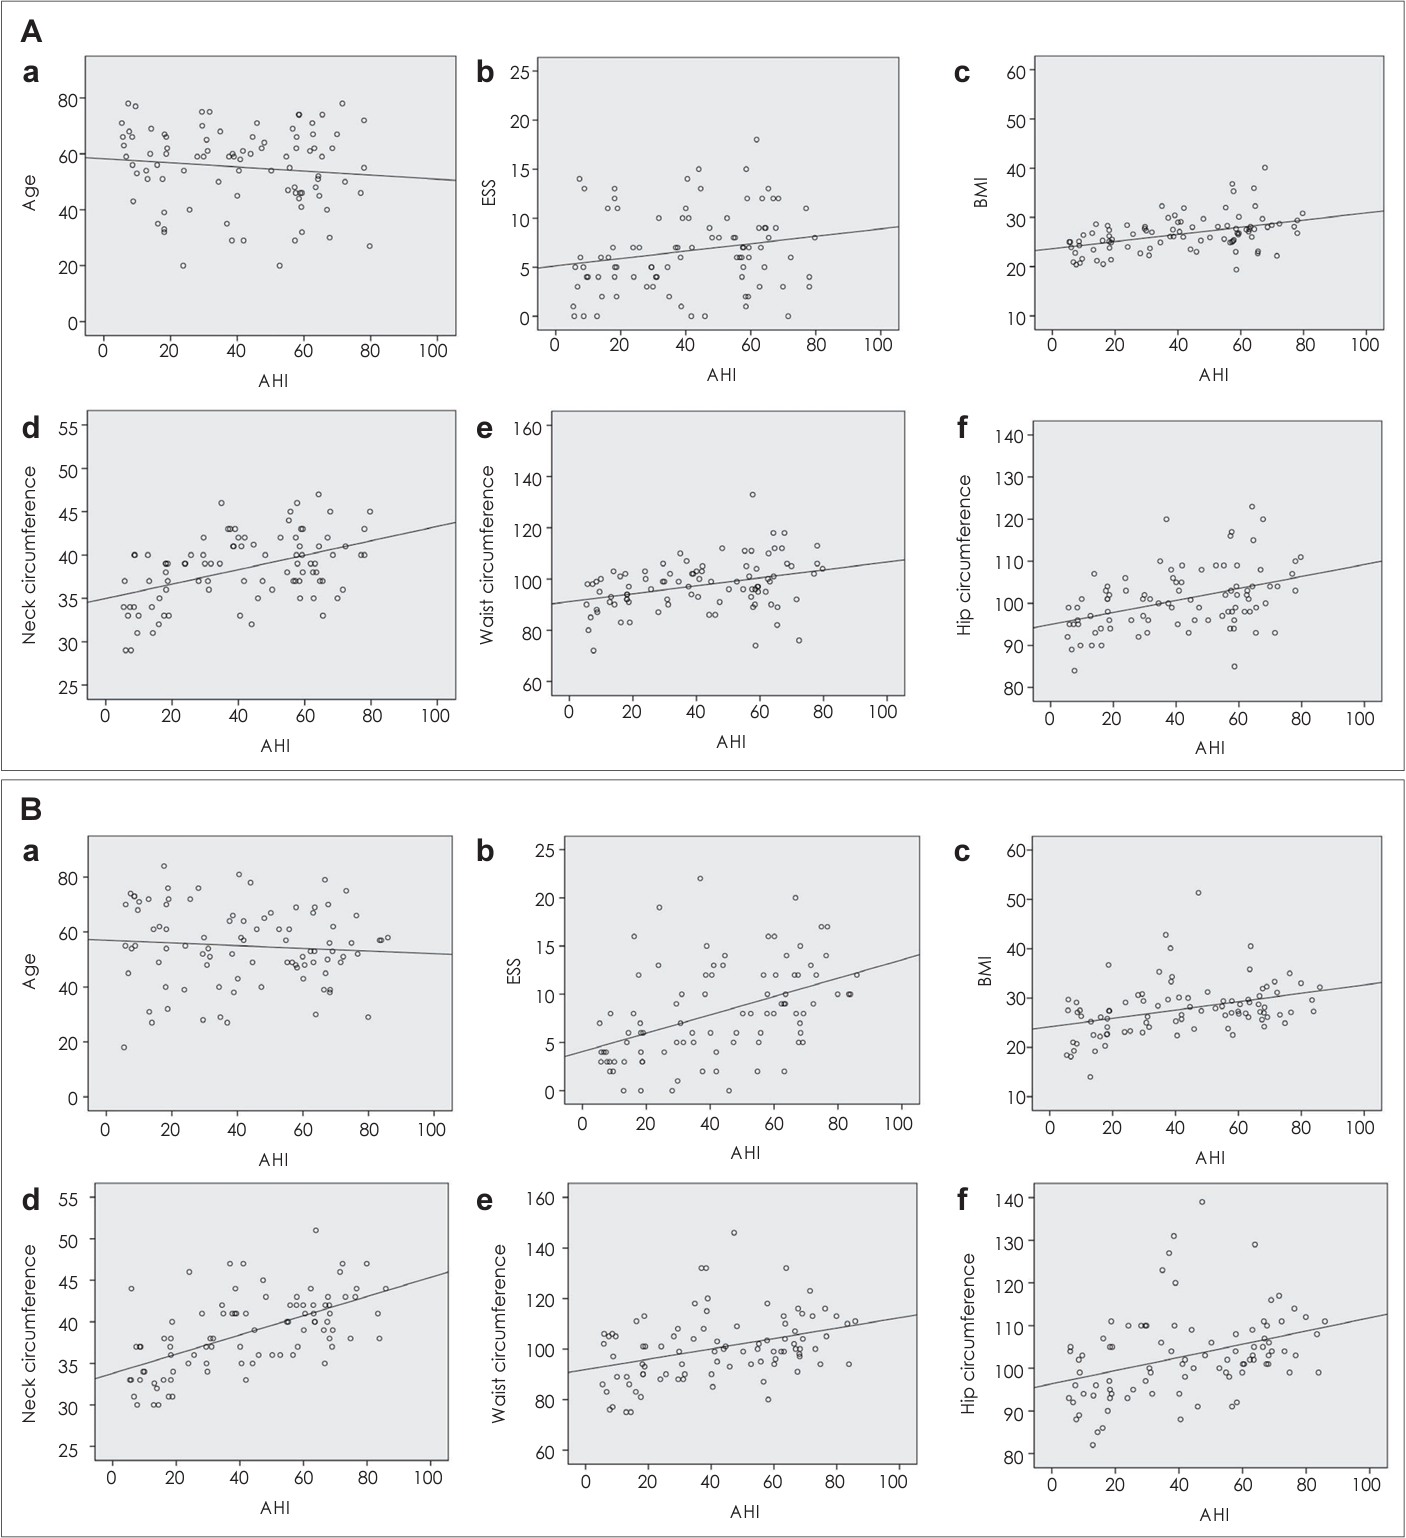
Correlation between the AHI and age, ESS, BMI, neck circumference, waist circumference, hip circumference. A: Correlation with AHI in non-positional group. Age: r=-0.08, p=0.452 (a); ESS: r=0.45, p<0.001 (b); BMI: r=0.37, p<0.001 (c); neck circumference: r=0.60, p<0.001 (d); waist circumference: r=0.37, p<0.001 (e); hip circumference: r=0.36, p<0.001 (f). B: Correlation with AHI in positional group. Age: r=-0.12, p=0.281 (a); ESS: r=0.20, p=0.059 (b); BMI: r=0.44, p<0.001 (c); neck circumference: r=0.47, p<0.001 (d); waist circumference: r=0.35, p=0.001 (e); hip circumference: r=0.42, p<0.001 (f). AHI, apnea-hypopnea index; ESS, Epworth Sleepiness Scale; BMI, body mass index.
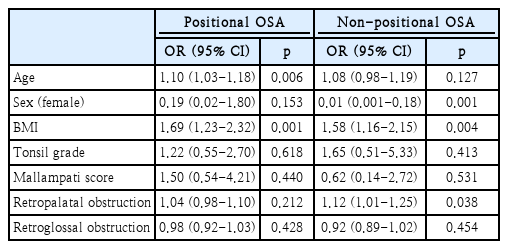
We further classified OSA patients into mild, moderate, and severe categories based on the AHI, with AHI thresholds defined as mild (5 to <15), moderate (15 to 30), and severe (>30). Due to PSM matching, the numbers of mild, moderate, and severe OSA cases in both groups were identical, with 15 (16.7%), 17 (18.9%), and 58 (64.4%) cases, respectively. To explore various risk factors associated with severe OSA, we conducted logistic regression analysis (Table 5). We found that BMI is a common risk factor associated with severe OSA in both positional (OR 1.69, p=0.001) and non-positional groups (OR 1.58, p=0.004). However, factors other than BMI showed differences between the two groups. In the positional OSA group, age was found to significantly impact severity (OR 1.10, p=0.006). In the non-positional OSA group, female sex (OR 0.01, p=0.001) and retropalatal obstruction (OR 1.12, p=0.038) significantly influenced severity.
APAP utilization
In the study, a total of 82 participants (45.6%) utilized APAP therapy, 43 (47.78%) in the positional OSA group and 39 (43.33%) in the non-positional OSA group. Notably, the non-positional OSA group demonstrated a higher proportion of days with APAP usage (84.74%±12.08% vs. 91.15%±8.87%, p=0.009) and a greater proportion of days with more than 4 hours of APAP usage (67.01%±23.72% vs. 77.36%±14.09%, p=0.021) (Table 6).
Discussion
Positional OSA, which entails a 50% or greater reduction in the AHI between supine and non-supine sleep positions, has been widely adopted in many studies [7]. In a South Korean study of 1052 OSA adults, positional OSA was found in 75.6% of cases [14]. Our study, involving 558 OSA patients, also showed a high prevalence, with 76.70% having positional OSA. This finding is consistent with another cohort study of 1224 OSA participants, in which 75% were identified with positional OSA [15].
Prior to data adjustment using PSM, the mean AHI for positional OSA was 28.47±16.56, whereas for non-positional OSA, it was 56.04±29.83. A study conducted by Beyhan Sagmen and Cömert [16] reported similar results, with non-positional OSA exhibiting greater AHI severity, presenting an AHI of 39.99±27.52 compared to positional OSA, which had an AHI of 15.56±10.61 (p<0.001). However, comparing clinical features using raw data would yield statistically inaccurate and biased results due to the large differences in group size and average AHI. Thus, we conducted PSM to select patients with similar AHI values, enhancing the accuracy of our results. This approach allowed us to compare the specific influence of positional and non-positional factors in OSA patients, excluding the impact of OSA severity. After performing PSM to balance the two OSA groups, we observed that patient demographics and clinical characteristics, including BMI and neck/waist/hip circumferences, were similar between the positional and non-positional OSA groups. Using the R program, pre- and post-PSM variables were compared to check for changes in distributions. Except for AHI, which was the variable used for matching the two groups, the distributions of age, BMI, neck, waist, hip circumference, average and minimum SpO2, and ESS were similar (Fig. 2). It is noteworthy that some studies have suggested that patients with positional OSA tend to exhibit lower BMI or smaller neck circumference [15,17]. But none of these studies accurately matched AHI between the two groups.
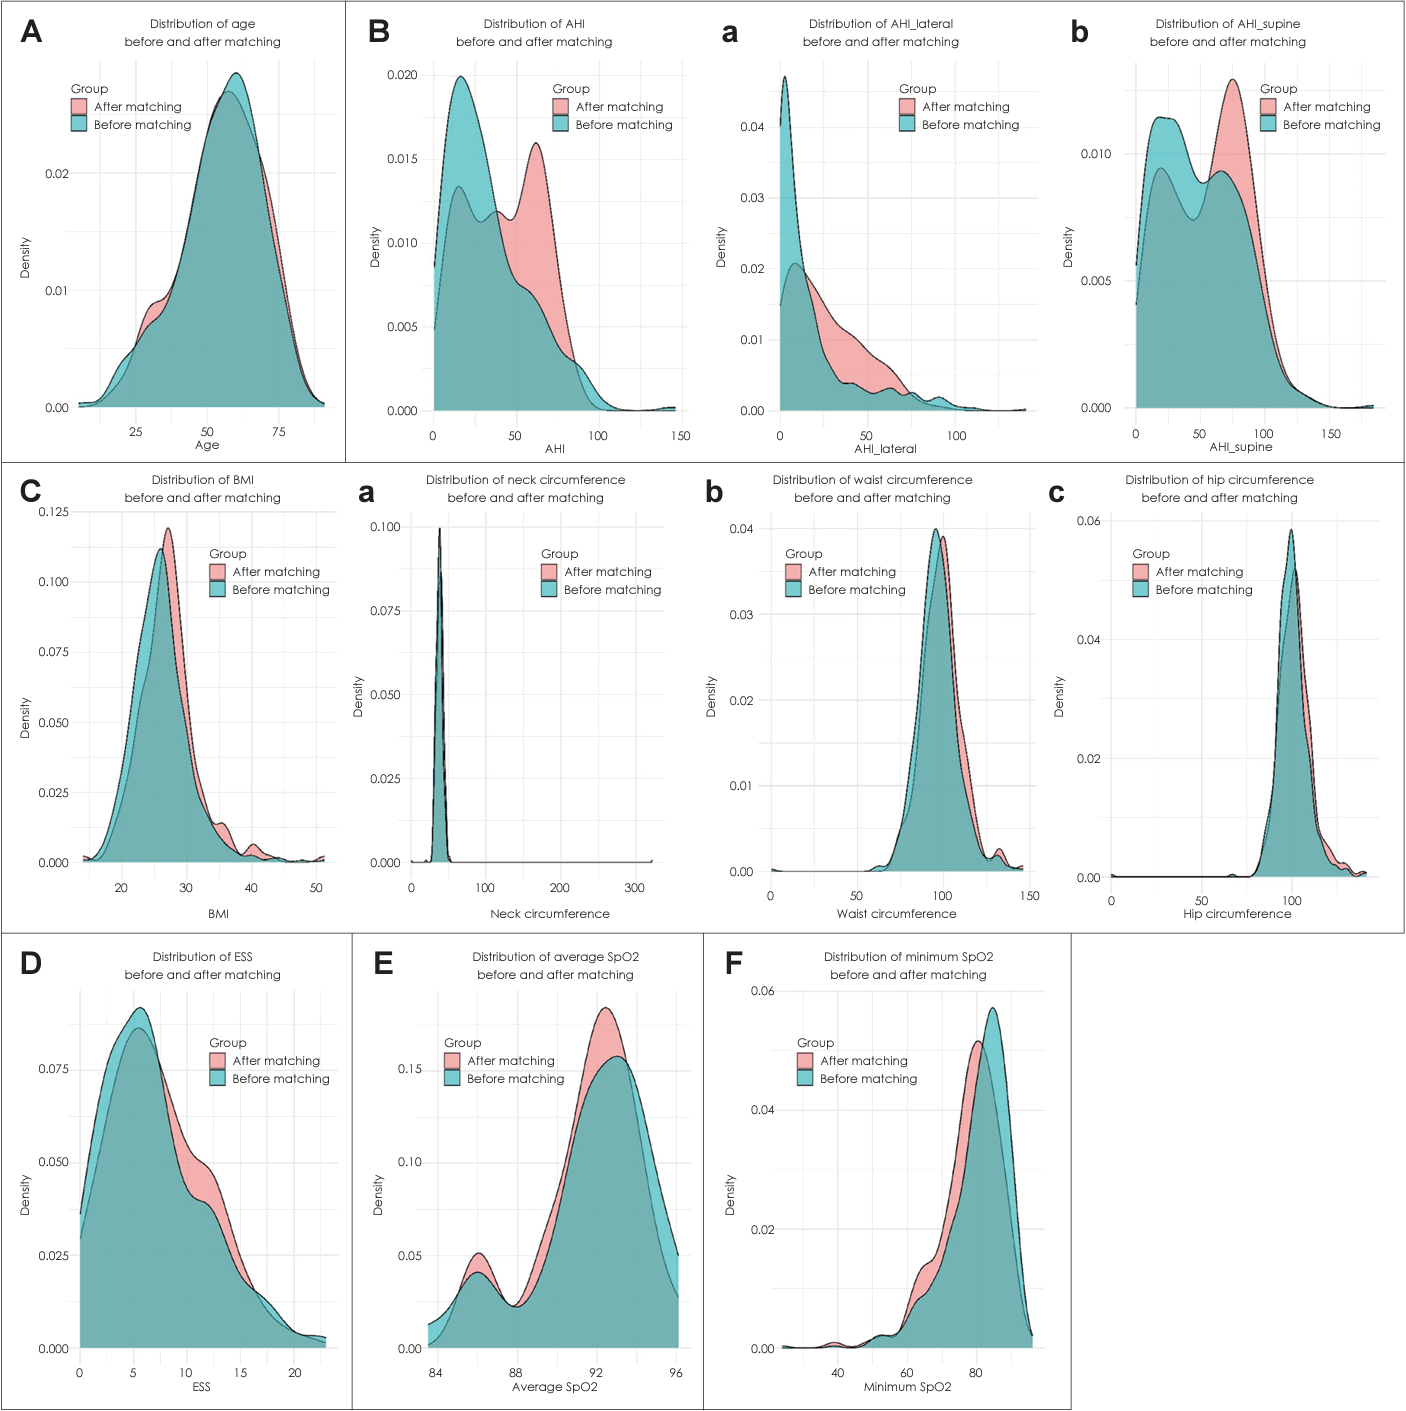
Comparison of variable distributions pre- and post-PSM. A: Age. B: AHI; AHI supine (a), AHI lateral (b). C: BMI; neck circumference (a), waist circumference (b), hip circumference (c). D: ESS. E: Average SpO2. F: Minimum SpO2. PSM, propensity-score matching; AHI, apnea-hypopnea index; BMI, body mass index; ESS, Epworth Sleepiness Scale; SpO2, oxygen saturation.
In our study, participants with non-positional OSA had significantly higher ESS scores compared to those in positional OSA group. Pearson correlation analysis revealed a positive link between ESS scores and AHI values in non-positional OSA, even when controlling for BMI. Temirbekov, et al.’s [18] study also supported this correlation in patients with moderate or severe OSA. This underscores the significance of assessing sleepiness as a potential marker for OSA severity in non-positional cases. In contrast, positional OSA may not demonstrate a significant symptom severity-AHI association. Thus, it’s crucial to inform patients that even with milder symptoms, they could have severe OSA requiring treatment based on AHI severity.
We also found that both OSA groups exhibited similar sleep quality and sleep stage distribution, except for oxygen levels. During sleep, the positional OSA group displayed significantly higher average and minimum SpO2 levels, and significantly lower T90, suggesting better oxygenation throughout the night. This difference may also relate to variations in symptom severity between the two groups. Furthermore, the severity of subjective symptoms could have influenced the utilization of APAP therapy.
Positive airway pressure (PAP) is the primary treatment for OSA, but compliance can be challenging due to issues such as mask discomfort, claustrophobia, pressure intolerance, and lifestyle factors. Compliance with APAP varies across studies; for instance, Dias, et al. [19] reported lower compliance among the positional OSA group. However, in our study, although the non-positional OSA group utilized APAP more frequently (proportion of days using APAP, p=0.009), we observed no significant differences in compliance between the two groups (p=0.063). The increased utilization of APAP in the non-positional OSA group may be associated with higher ESS scores. However, compliance with APAP therapy seems to be affected by factors more complex than just subjective symptoms and positional factors. Therefore, it may be beneficial to consider additional psychological and physiological conditions when encouraging the use of APAP therapy.
We subdivided OSA patients into mild, moderate, and severe categories to analyze factors related to severe OSA. Before PSM, most patients in both groups had severe OSA. We had 15, 17, and 98 cases (11.5%, 13.1%, and 75.4%) for mild, moderate, and severe OSA in the non-positional group respectively, and 100, 162, and 166 cases (23.4%, 37.9%, and 38.8%) in the positional OSA group respectively. However, after PSM matching, both groups had an equal distribution of OSA severity. Logistic regression revealed higher BMI as a common risk factor for severe OSA in both groups. However, the groups differed in other factors. In the positional OSA group, age had a substantial impact on severity, while male sex and retropalatal obstruction were related to severity in the non-positional OSA group. Therefore, these results suggest that there may be differences in OSA pathophysiology between the two groups.
In our study, the non-positional OSA group showed an association with BMI and anatomical narrowing leading to upper airway obstruction such as retropalatal obstruction. Supporting this observation, Lee, et al. [20] noted that changing from supine to lateral sleep positions improved tongue base and larynx obstructions, linking lateral position obstruction to oropharyngeal lateral wall collapsibility. Lan et al.’s [21] multivariate analysis identified oropharyngeal lateral wall collapse as the primary anatomical predictor for non-positional OSA. Notably, 62.5% of these patients had more severe oropharyngeal lateral wall collapse in the lateral position.
In the positional OSA group, age may be associated due to factors like decreased muscle tone in the supine position, leading to increased pharyngeal collapsibility [22]. Several studies suggest that pharyngeal collapsibility in older patients is due to increased pharyngeal fat pads, lengthening of the soft palate, and ultimately narrowing the upper airways. Additionally, a decrease in the negative pressure reflex of the genioglossus muscle, a mechanism that compensates for pharyngeal collapse, has been observed as individuals age [23]. Aging is also associated with an elevated end expiratory lung volume (EELV), which can influence the activity of dilator muscles. Another study by Stanchina, et al. [24] demonstrated that genioglossus muscle activity declines as EELV increases. Furthermore, the aging process is linked to a reduction in the elastic recoil of the lungs, resulting in an overall increase in EELV [25]. As identified in previous studies, multiple factors are related to causing positional and non-positional OSA.
Our study offers several advantages. Firstly, while many studies have compared positional and non-positional OSA groups with significant differences in AHI, our study conducted a comparison between the two groups with similar AHI values using PSM. Additionally, we sought to understand the pathophysiology underlying AHI and OSA severity in each group, going beyond mere clinical differences. Moreover, beyond assessing clinical features, we also evaluated APAP utilization, providing valuable insights for comparing the two groups. However, this study has important limitations to address. Due to the large difference in the number of participants between the two groups (positional OSA: 428 vs. non-positional OSA: 130), the reliability of the analysis results before applying PSM was questioned. To address this issue, we decided to use 1:1 PSM based on AHI values. By matching each participant through 1:1 matching, we were able to precisely adjust the balance between the two groups. However, this adjustment resulted in a significant reduction in sample size post-PSM, from 558 to 180. Additionally, the statistical power of our study is lower compared to utilizing 1:2 matching, which is a notable limitation. Therefore, for future analyses, a larger sample size and the utilization of 1:2 or 1: n matching of AHI scores should be considered when comparing the positional and non-positional OSA groups. In addition, due to the nature of the retrospective study, there was limited information on factors affecting APAP compliance. Thus, further exploration of the various factors affecting APAP compliance is warranted. Further research, fundamentally examining the physiological differences between positional and non-positional AHI, is essential to comprehend the pathophysiological distinctions between the groups.
In conclusion, we found that non-positional OSA patients exhibited more severe symptom scores compared to those with positional OSA. Although a higher proportion of APAP usage was observed in the non-positional OSA group, no significant differences in APAP compliance were found between the two groups. Higher BMI was a common risk factor for severe OSA in both groups. However, age was a significant risk factor in severe positional OSA, while sex and retropalatal obstruction were significant factors in severe non-positional OSA. This suggests that there might be differences in the pathophysiology of non-positional and positional OSA. Further research to elucidate the pathophysiological characteristics of these two groups in more detail would be beneficial.
Acknowledgements
I would like to express my sincere gratitude to Professor Surak Ryu at Hanyang University for his invaluable statistical advice and guidance. His expertise and support in the application of statistical methods greatly contributed to the success of this work.
Notes
Author Contribution
Conceptualization: Jin Hye Kwak, Seon Min Jung, Jin Hyeok Jeong. Data curation: Jin Hye Kwak, Seong Man Hong. Formal analysis: Jin Hye Kwak, Seon Min Jung. Methodology: Jin Hye Kwak, Seok Hyun Cho, Seon Min Jung. Project administration: Seon Min Jung, Jin Hyeok Jeong. Supervision: Seok Hyun Cho, Seon Min Jung, Jin Hyeok Jeong. Validation: Jin Hye Kwak, Seon Min Jung, Jin Hyeok Jeong. Visualization: Jin Hye Kwak, Seong Man Hong, Seon Min Jung. Writing—original draft: Jin Hye Kwak. Writing—review & editing: Seon Min Jung, Jin Hyeok Jeong.


