청신경초종 환자의 청력에 영향을 미치는 요인들에 대한 포괄적인 분석
Comprehensive Analysis of the Contributing Factors to the Hearing Abilities of Patients With Vestibular Schwannoma
Article information
Trans Abstract
Background and Objectives
This study aimed to comprehensively assess the factors influencing hearing ability in patients with vestibular schwannoma, focusing on tumor size, location, primary complaint, and contralateral hearing threshold.
Subjects and Method
This was a retrospective analysis of 50 patients diagnosed with vestibular schwannoma by magnetic resonance imaging (MRI) at Nowon Eulji Medical Center. Tumor size and location were evaluated using a 3-T MRI system, and pure-tone threshold and speech discrimination were retrieved. To investigate the relationship between tumor size and hearing, we conducted a multiple regression analysis with several variables, including tumor size, tumor location, patient age, and gender.
Results
When patients were categorized into groups according to their primary complaint at initial presentation, no significant differences were observed in pure tone thresholds but different speech discrimination were detected among the groups. When patients were classified according to the tumor location, the extrameatal group exhibited lower pure-tone thresholds and higher speech discrimination scores than the intrameatal group. Multiple regression analysis indicated that differences in pure tone thresholds and speech discrimination scores between affected and unaffected sides were more pronounced in cases with smaller tumor sizes and extrameatal tumor locations, emphasizing the greater impact of location over size.
Conclusion
Using both tumor size and location, it is possible to predict the differences in pure-tone thresholds and speech discrimination between the affected and unaffected sides. Extrameatal invasion of the tumor appears to be the most important factor among them.
Introduction
Vestibular schwannoma is a benign tumor originating from the vestibular nerve branches of the eighth cranial nerve and accounts for 8%-10% of all intracranial tumors and about 90% of tumors in the cerebellopontine angle (CPA). In 80% of patients with vestibular schwannoma, the initial and primary complaints are often related to auditory symptoms, such as hearing loss or tinnitus. Rare cases also present with symptoms like facial paralysis, dizziness, weakness, and headache [1]. With advances in imaging technology, more cases of vestibular schwannoma have been incidentally detected by cranial MRI. In the majority of cases, these tumors are small and asymptomatic, prompting a watch-and-wait management approach [2]. Historically, the decline in hearing ability in patients with vestibular schwannoma was attributed to mechanical factors. This includes compression or traction on the cochlear nerve, leading to impaired conduction, as well as obstruction or constriction of the labyrinthine artery, resulting in reduced blood supply to the cochlea [3-5]. Pathological studies have revealed degeneration of the cochlear nerve (75%), vestibular nerve (88%), stria vascularis (69%), and spiral ganglion neurons (85%) in patients with vestibular schwannoma [6]. However, the mechanical degeneration theory cannot account for the deterioration of hearing in patients without an increase in tumor size. Elevated levels of perilymphatic proteins have been reported in patients with vestibular schwannoma, ranging from 5 to 15 times higher than those found in healthy individuals [7]. This biochemical alteration, combined with the accumulation of toxic substances released by the tumor, may contribute to neurotoxic damage, and ultimately the deterioration of hearing [8].
Several studies have examined the association between tumor size or location and hearing ability in patients with vestibular schwannoma [6]. Tringalie, et al. [9] reported that the low-frequency hearing threshold was higher in patients with Koos stage T4 than in patients with other stages, but no significant differences were found across the entire frequency range. In a Danish study of 156 patients with vestibular schwannoma, tumor size and sublocation were not significantly related to changes in hearing during the observation period [10]. Another study categorized tumors as small or large based on a cutoff size of 20 mm, but no significant correlations were found between tumor size and hearing ability, or between the extent of internal auditory canal (IAC) involvement and hearing ability [11]. In a systematic review that investigated the correlation between two-dimensional tumor size measured by MRI and hearing ability, only 2 out of 10 studies found a significant relationship, in which larger tumor size was positively correlated with greater hearing impairment [12]. By comparison, all four studies that calculated the three-dimensional tumor volume demonstrated a significant correlation between tumor size and hearing impairment [12].
Studies that classified vestibular schwannoma into IAC and CPA tumors yielded mixed results. Two studies showed that severe hearing impairment was worse in patients with CPA tumors than in patients with IAC tumors [13,14], but two other studies did not find a significant relationship [15,16]. Similarly, studies that classified IAC tumors into those located in the porus, fundus, and central locations did not reveal any significant correlations between tumor location and hearing impairment [10,17,18].
Previous studies primarily focused on the correlation between hearing abilities and tumor factors, such as the size, location, and growth rate, as separate independent variables. For more accurate analysis, it is important to consider these factors comprehensively. Additionally, previous studies overlooked the impact of the contralateral hearing threshold, which could potentially affect the patient’s existing hearing loss. By analyzing hearing on the affected side without considering the unaffected side, there is a risk of confounding or interacting effects of age and pre-existing hearing loss. Therefore, the objective of this study was to evaluate comprehensively whether various contributing factors, including primary complaint, tumor size, tumor location, and contralateral hearing threshold, could collectively explain the hearing abilities of patients with vestibular schwannoma. This comprehensive approach sought to provide a more accurate understanding of the relationship between hearing abilities and the characteristics and stages of vestibular schwannoma.
Subjects and Methods
Subjects
This was a retrospective analysis of 50 patients (54.5 years, standard deviation [SD]=12.3 years; male:female ratio=15:35) who were diagnosed with vestibular schwannoma after undergoing MRI at the Department of Otolaryngology at Nowon Eulji Medical Center between 2013 and 2022. MRI was performed using a 3-T system (Skyra, Siemens Health Care, Erlangen, Germany) with a 16-channel sensitivity-encoding head coil. The protocols included axial T1-weighted, T2-weighted fast spin-echo, and contrast-enhanced T1-weighted images that were obtained in three orthogonal planes with a section thickness of 2 mm. The tumor size and location were determined by a neuroradiologist during the initial evaluation. Using MRI, the tumor size was measured as the largest diameter in millimeters on three planes. Tumor location was classified based on the radiological report as intrameatal if it was exclusively detected in the IAC or as extrameatal if the tumor extended into the CPA involving the IAC. Pure-tone audiometry data were taken from tests performed closest to the time of initial tumor detection on MRI. The pure-tone average (PTA) was calculated as the average of thresholds at 500 Hz, 1000 Hz, 2000 Hz, and 3000 kHz. To account for the patient’s pre-existing hearing ability, the differences in pure-tone thresholds between the affected and unaffected sides were calculated for each frequency. This study was approved by the Institutional Review Board at Nowon Eulji Medical Center (approval number: EMCS-2023-03-014).
Statistical analysis
One-way analysis of variance with Bonferroni post hoc tests was conducted to compare patients divided into groups according to their primary complaint. The pure-tone thresholds were compared between the extrameatal and intrameatal groups using independent-sample t tests. Pearson’s correlation coefficient was used to explore the correlation between tumor size and pure-tone thresholds for each frequency. To investigate the relationship between tumor size and hearing, we conducted multiple regression analysis in which tumor size, tumor location, patient age, and gender were included as variables using the stepwise selection method. All statistical analyses were performed using IBM SPSS software (ver. 25.0, IBM Corp, Armonk, NY, USA). p values of <0.05 were considered significant.
Results
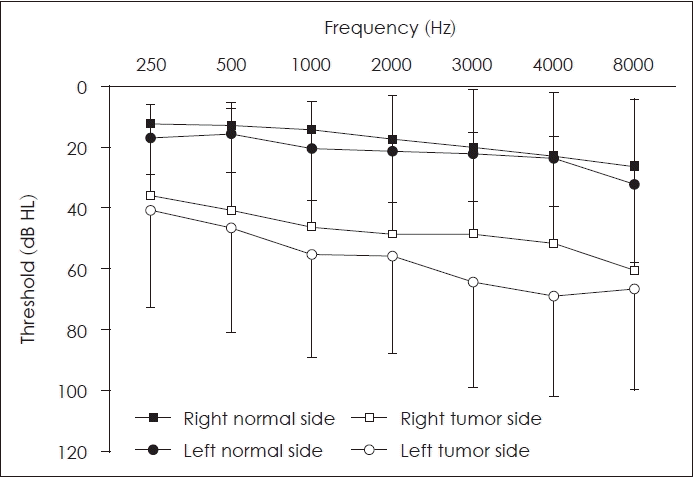
Among the 50 patients, the mean tumor size was 12.8 (SD=8.2) mm. Fig. 1 illustrates the hearing thresholds at the different frequencies, differentiating between the side affected by the tumor and the contralateral healthy side. The mean PTA for the side with the tumor was 51.1 (SD=31.3) dB HL, and the corresponding value for the normal side was 17.9 (SD=12.5) dB HL. Of all patients included in this study, seven were classified as deaf (bilateral PTA >90 dB HL); these seven patients had tumors extending to the extrameatal region, with a mean tumor size of 18.0 (SD=6.6) mm. Meanwhile, for eight patients with normal hearing (PTA ≤20 dB HL), the mean tumor size was 14.8 (SD=16.7) mm, of which five patients had intrameatal tumors and three had extrameatal tumors.
Comparison among groups based on primary complaint
Among the 50 patients, 25 presented with sudden hearing loss as their primary complaint, nine reported gradual hearing loss, eight experienced dizziness, and four complained of tinnitus. Additionally, vestibular schwannoma was incidentally detected during brain MRI in four patients (Table 1).
When comparing the mean ages and hearing abilities according to the primary complaint, the patients with sudden hearing loss (mean=48.7, SD=13.1 years) were younger than patients with progressive hearing loss (mean=63.6, SD=14.4 years, Bonferroni-adjusted p=0.032) and patients with dizziness (mean=67.8, SD=11.8 years, Bonferroni-adjusted p=0.005). There were no significant differences in tumor size or PTA among patients divided by the primary complaint (p>0.05). But, patients with progressive hearing loss had significantly lower speech discrimination score (SDS) in the affected side compared with patients with sudden hearing loss (Bonferroniadjusted p=0.03), and significantly higher difference of SDS compared with the patients with tinnitus (Bonferroni-adjusted p<0.001) and patients with incidentally detected tumors (Bonferroni-adjusted p<0.001).
Comparison according to the tumor size
Patients were divided into three groups based on tumor size, at 10-mm intervals (Table 2). There was no significant difference in the mean ages of the groups. Tumors ≤10 mm in size were exclusively located intrameatally, accounting for 22 patients. By comparison, tumors >20 mm were exclusively located extrameatally, accounting for 10 patients. When comparing the PTA and SDS of the affected side, the group with tumors ≤10 mm in size had significantly better hearing abilities than the group with tumors between 10 and 20 mm in size (Bonferroni-adjusted p=0.015 and p=0.004 respectively). Similar results were observed when we compared the differences in PTA and SDS between the affected and unaffected sides among the groups (Bonferroni-adjusted p=0.015 and p=0.012 respectively).
Comparison according to tumor location
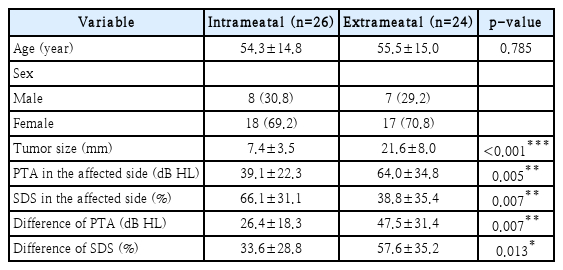
When the patients were classified according to tumor location, 26 patients had intrameatal tumors (mean size=7.4, SD=3.5 mm) and 24 patients had extrameatal tumors (mean size=21.6, SD=8.0 mm). The tumor size was significantly different between the two groups (p<0.001) (Table 3). We also found a significant difference in the PTA of the affected side between the intrameatal group (mean=39.1, SD=22.3 dB HL) and the extrameatal group (mean=64.0, SD=34.8 dB HL; p=0.005) (Table 3). Similarly, the difference in PTA between the affected and unaffected sides was significantly smaller in the intrameatal group (mean=26.4, SD=18.3 dB HL) than in the extrameatal group (mean=47.5, SD=31.4 dB HL; p=0.007). Furthermore, the SDS of the affected side (mean=38.8%, SD=35.4% vs. mean=66.1%, SD=31.1%, p=0.007) and the difference in SDS between the affected and unaffected sides (mean=57.6%, SD=35.2% vs. mean=33.6%, SD 28.8%; p=0.013) were significantly different between the extrameatal group than in the intrameatal group.
Correlation analysis between hearing abilities and tumor size
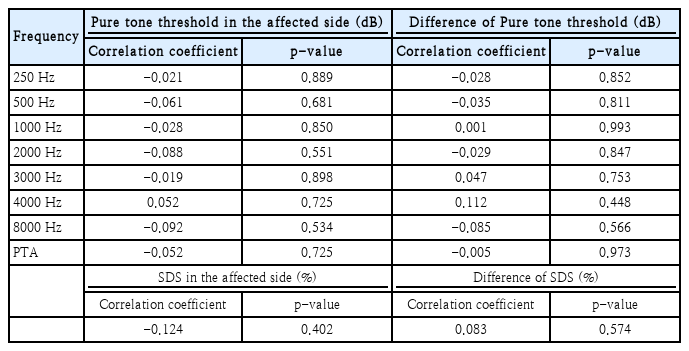
The correlation analysis between the hearing threshold of the affected side and tumor size showed no significant correlations at any of the frequencies (all p>0.05) (Table 4). Additionally, we found no significant correlations between the difference in hearing thresholds between the affected and unaffected sides and tumor size (all p>0.05). Furthermore, the tumor size was not significantly correlated with the SDS of the affected side, or the difference in SDS between the affected and unaffected sides (all p>0.05) (Table 4).
Multiple regression analysis
The multiple regression analysis included age, sex, tumor location, and size as predictors, and incorporated the variables using the stepwise method.
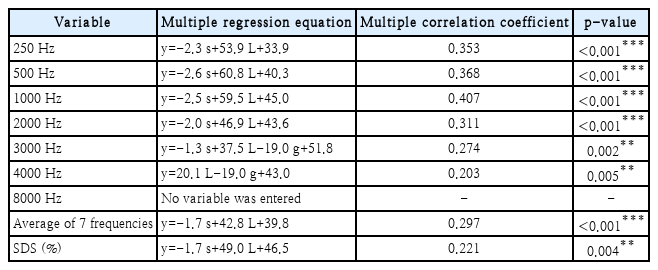
Table 5 presents the multiple regression equations and multiple correlation coefficients for each threshold and for SDS of the affected side. In this analysis, tumor size and location were found to be significant variables for the frequencies 250 Hz, 500 Hz, 1000 Hz, and 2000 Hz. At 3000 Hz, the model included age and gender, and had the highest multiple correlation coefficient of 0.480. Tumor size was excluded from the model at 4000 Hz, with only location, gender, and age being significant variables. At 8000 Hz, only the patient’s age was a significant variable. The average of all seven frequencies was explained by tumor size, location, and age. Finally, the model of SDS only included tumor location and age; tumor size was excluded from this model.
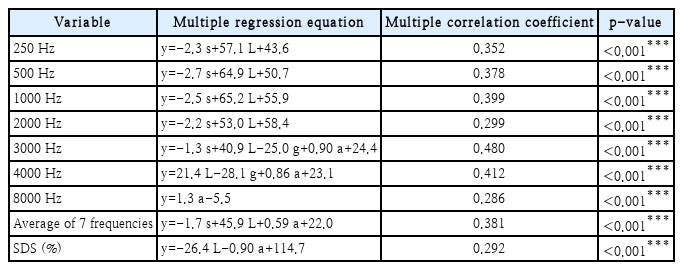
Multiple regression equations for the pure-tone threshold of the affected side according to frequency and independent variables
Table 6 shows the multiple regression equations and multiple correlation coefficients for the difference in thresholds and SDS between the affected and unaffected sides. In the multiple regression analysis of the difference in thresholds between the affected and unaffected sides, tumor size and location were significant variables in the models for 250 Hz, 500 Hz, 1000 Hz, and 2000 Hz (Table 6). When considering hearing of the unaffected side, the difference in the average of all seven frequencies between the affected and unaffected sides was explained by both tumor size and location, but excluded age. When we analyzed the difference in SDS between the affected and unaffected sides, age, which had been included in the model for the SDS on the affected side, was excluded, and instead, tumor size was included as an explanatory factor.
Discussion
The most common symptom experienced by patients diagnosed with vestibular schwannoma is hearing loss, typically occurring on the affected side [1,5,6,10]. When the vestibular schwannoma grows in size and extends beyond the IAC and involves the CPA, patients may experience additional central symptoms such as disequilibrium and headache [6]. In our study, out of the total sample of 50 patients, 38 patients (76%) presented with auditory symptoms, including sudden hearing loss, progressive hearing loss, or tinnitus. Similar results were reported in previous studies, in which approximately 80% of the patients experienced auditory-related symptoms [1,12]. However, when we compared hearing among patients with the different symptoms, we found no significant differences in their hearing abilities.
The current study revealed that, when the tumor extended to the extrameatal region, hearing loss was more pronounced than when the tumor was confined to the intrameatal region. However, previous studies reported different results. Cazzador, et al. [16] divided patients into two groups based on their hearing abilities as “useful hearing” (PTA ≤30 dB, SDS ≥70%) and “impaired hearing” (PTA >30 dB, SDS <70%) and, unlike the current study, they observed no significant difference in the ratio of useful hearing and impaired hearing between patients with extrameatal or intrameatal tumors. In another study that compared the hearing abilities of three groups of patients according to whether the tumor was confined to the IAC, extended to the CPA, or caused stem compression, no statistically significant differences in hearing abilities were found among the three groups [15].
We hypothesized that there might be a correlation between the difference in bilateral hearing (i.e., hearing threshold of the affected side minus the hearing threshold of the unaffected side) and tumor size. If there were hearing impairment of the unaffected side, it would combine the effects of the tumor-related hearing impairment with the pre-existing hearing loss of the affected side. In such cases, it is reasonable to analyze the difference in hearing between the affected and unaffected sides. However, we found no significant correlation, which could be because the contralateral hearing ability was closer to normal in most patients. Therefore, future larger-scale studies may need to enroll and analyze patients with hearing impairment on the unaffected side.
Previous studies that solely analyzed tumor size without considering its location found no significant correlation with hearing abilities [9,10,12]. Similar results were observed in our correlation analysis between hearing ability and tumor size. However, when we considered multiple factors simultaneously in the multiple regression models, factors such as tumor size, location, age, and gender influence the hearing thresholds and speech discrimination of the affected side, emphasizing the greater impact of location over size.
When we considered the patients’ hearing abilities on the unaffected sides, the difference in hearing thresholds between the affected and unaffected sides could be explained by both tumor size and location for the average threshold of all seven frequencies, while age was excluded as a factor. Moreover, when we analyzed the SDS of the affected side, tumor size was not a significant explanatory factor. However, when we analyzed the difference in SDS between the affected and unaffected sides, tumor size was included as an explanatory factor instead of age. This suggests that age, a factor related to baseline hearing, can be excluded when considering the difference in hearing ability between the affected and unaffected sides, rather than when considering hearing ability on the affected side only.
One limitation of this study is that the sample size may not be sufficient, which could affect the accuracy of the results. In addition, this study used the maximum diameter of the tumor rather than the three-dimensional volume of the tumors due to technical limitations. Therefore, further validation and additional studies with a larger number of patients should be conducted, possibly as multicenter studies.
In conclusion, our findings suggest that initial symptoms did not lead to significant differences in the pure-tone threshold. However, in the SDS, the group of patients with vestibular schwannoma reporting progressive hearing loss exhibited relatively lower scores. Using both tumor size and location, it is possible to predict the differences in pure-tone thresholds and speech discrimination between the affected and unaffected sides. Extrameatal invasion of the tumor appears to be the most important factor among them. The impact of age on the hearing ability of patients may be controlled when we simultaneously consider the hearing ability of the unaffected side.
Acknowledgements
This work was supported by the National Research Foundation of Korea (NRF) grant funded by the Korean government (NRF-2020R1I1A3071587).
Notes
Author contributions
Conceptualization: Hyun Joon Shim. Data curation: Jung Ho Choi, Yong-Hwi An, Ra Gyoung Yoon. Formal analysis: Jung Ho Choi. Funding acquisition: Hyun Joon Shim. Methodology: Hyun Joon Shim, Yong-Hwi An, Ra Gyoung Yoon. Writing—original draft: Jung Ho Choi, Hyun Joon Shim. Writing—review & editing: Hyun Joon Shim, Yong-Hwi An.

