전정신경초종의 자연 경과에 따른 종양의 성장과 청력의 변화
Tumor Growth and Hearing Changes in the Natural Progress of Vestibular Schwannoma
Article information
Trans Abstract
Background and Objectives
Vestibular schwannoma is a benign neoplasm originating from the vestibular nerve, and the most common symptom caused by the tumor is unilateral hearing loss. This study is aimed to review the clinical outcomes of tumor growth and hearing changes in the natural progress of vestibular schwannoma.
Subjects and Method
We retrospectively reviewed 28 patients who were diagnosed with vestibular schwannoma and treated with the ‘wait and scan’ modality for more than a year. We analyzed the patients’ audiological changes and tumor growth by reviewing the temporal bone MR images. Patients were classified into an intrameatal group and extrameatal group according to the involvement of the cerebropontine angle.
Results
The overall mean follow-up was 45.6±25.8 months. Among the 28 patients, 6 (21.4%) showed tumor growth after ‘wait and scan.’ Hearing thresholds and speech discrimination scores showed deterioration after ‘wait and scan’ in both groups. Among the 12 patients with serviceable hearing at initial diagnosis, 9 (75.0%) preserved serviceable hearing after ‘wait and scan.’ When the pure tone average and speech discrimination scores were applied to the scattergram, most values were positioned near the center of the scattergram, which implied slight changes after ‘wait and scan.’
Conclusion
The percentage of patients showing tumor growth after the ‘wait and scan’ policy was low. Patients with serviceable hearing at diagnosis would most likely preserve their hearing after ‘wait and scan.’ Considering the limited tumor growth and minimal hearing changes, rather than microsurgery or radiation surgery, the conservative ‘wait and scan’ policy can be an alternative treatment modality in patients with small-sized, non-growing vestibular schwannomas.
서 론
전정신경초종(vestibular schwannoma)은 내이도나 소뇌교각부의 8번째 뇌신경의 전정신경분지에서 생기는 양성 신경초종으로, 청력 감소 및 평형 장애가 발생하여 급성 미로염 또는 메니에르병으로 잘못 진단되거나 진단이 늦어지기도 한다[1,2]. 그 중 가장 흔하게 발생하는 증상들 중 하나는 일측성 청력 감소이며, 청력은 시간이 지남에 따라 점점 감소하는 소견을 보인다[3].
최근 자기 공명 영상(magnetic resonance imaging)의 발달과 함께 다양한 크기의 전정신경초종의 조기 진단이 가능해지면서 수술적 치료나 정위적 방사선 수술과 같은 적극적인 치료법이 제시되고 있다. 하지만, 이러한 적극적인 치료법들에 의한 이환율을 고려하여 크기가 작은 전정신경초종의 경우 수술보다는 추적 관찰(wait and scan)을 일차 치료로 선택하기도 한다[4]. 치료법을 결정하는 중요한 임상기준 중의 하나는 진단 당시 환자의 청력상태이고 청력 저하는 환자의 삶의 질 저하와 밀접한 관련이 있으므로 각 치료에 따른 청력의 예후를 설명하는 것은 꼭 필요한 부분이다[5].
최근 다양한 연구들이 전정신경초종과 청력의 상관 관계에 대해 그래프 및 도표를 이용하여 분석 및 도식화하였다. 대표적으로 순음 청력 검사(pure tone audiometry)와 어음 명료도 검사(speech discrimination score)를 이용하여 사회적응청력(serviceable hearing) 여부를 구분하는 American Academy of Otolaryngology-Head and Neck Surgery(AAO-HNS) 분류법[6]과 Kanzaki 등[7]이 제시한 분류법 등이 있다. 그리고 최근 청력과 어음 명료도를 산포도(scattergram)에 접목시켜 각 청력과 어음 명료도에 해당하는 구간에 몇 명이 해당되는지, 그리고 각 수치의 변화를 시각적으로 간편화한 연구 결과도 발표되었다[8].
이에 본 연구에서는 추적 관찰을 시행한 전정신경초종 환자들에서 종양의 성장과 청력의 변화를 도표 및 그래프를 이용하여 분석해보고 그 임상적 의미를 고찰해보고자 하였다.
대상 및 방법
대 상
2007년 3월~2018년 12월까지 순천향대학교 부천병원 이비인후과에서 전정신경초종으로 진단받거나, 타 과에서 진단받은 후 이비인후과로 협진 의뢰된 환자들 중 진단 당시 종양의 크기가 20 mm 이하인 경우 추적 관찰을 시행하였으며, 그들의 의무기록을 후향적으로 분석하였다.
각 환자들의 첫 외래 내원 당시 주 증상, 종양의 성장 속도 및 위치, 청력 변화 등을 의무기록을 통해 조사하였다. 1년 이하의 기간 동안 추적 관찰했거나 정기적 외래 추적 관찰에 실패한 환자들은 이번 연구에서 제외하였다. 또한 추적 관찰을 시행하던 전정신경초종 환자들 중 중추 신경계 합병증이 발생하거나 안면 마비가 발생한 경우, 다발성 전정신경초종을 일으킬 수 있는 신경섬유종증 2형 환자들도 본 연구에서 제외하였다. 본 연구는 본원 임상 시험 심사 위원회(Institutional Review Board)의 승인을 받아 시행하였다(IRB No. 2019-04-027).
청력학적 평가
모든 환자들은 내원 당시 순음 청력 검사와 어음 명료도 검사를 시행하였으며, 청력의 변화는 첫 내원 당시와 마지막 외래 내원 때의 순음 청력 검사와 어음 명료도 검사 수치를 비교하였다. 순음 청력 검사는 0.5, 1, 2, 3 Hz 주파수의 청력 역치값의 평균으로 계산하였고, 어음 명료도 검사는 단음절 단어 목록을 환자에게 읽게 한 뒤 정확히 발음한 경우를 퍼센트로 표시하였다.
각 환자들의 순음 청력 역치의 평균과 어음 명료도 수치를 이용하여 AAO-HNS 분류법을 통해 A, B, C, D군으로 분류하였다. 사회적응청력은 AAO-HNS 분류법에서 순음 청력 역치의 평균이 50 dB HL 미만이고 어음 명료도가 50%를 초과하는 A군과 B군에 해당하는 구간의 청력으로 정의하였다.
산포도는 순음 청력 역치값의 평균과 어음 명료도값을 이용하여 격자 모양의 칸에 해당하는 환자 수를 채워 넣는 방식으로 진단 당시와 추적 관찰 전후의 변화 정도를 나타내었다.
영상의학적 평가
측두골 자기공명영상의 경우, 첫 내원 당시 조영증강 측두골 자기공명영상으로 촬영한 뒤, 이후 1년 주기로 촬영하여 종양의 크기를 비교하였다. 전정신경초종은 그 위치에 따라 내이도(internal acoustic meatus)에 국한된 종양군(intrameatal group)과 내이도를 포함하여 소뇌교각(cerebropontine angle)까지 침범한 종양군(extrameatal group)으로 나누었다.
종양의 크기는 내이도 부위가 포함된 종양의 직경 중 가장 긴 부위를 측정하였다. 종양 성장의 기준은 1년을 주기로 촬영한 자기공명영상을 비교하였을 때 2 mm 이상 크기가 증가한 경우를 유의하게 성장한 것으로 간주하였다. 환자가 수술이나 방사선 수술을 시행한 경우, 치료 전 마지막으로 촬영한 측두골 자기공명영상을 기준으로 종양의 크기를 측정하였다.
통계 분석
Intrameatal과 extrameatal군의 임상적 특성의 통계적 차이 및 전정신경초종 부위의 청력과 정상 부위의 청력의 추적관찰 전후 비교를 검증하기 위해 Student’s t-test를 이용하였고, 위치에 따른 두 군 간의 종양 성장 비율의 통계적 차이는 Fisher’s exact test를 통해 검증하였다. 모든 통계적인 검정은 양측 검정을 기반으로 p값이 0.05 미만일 때 통계적으로 유의한 것으로 간주하였으며, 통계분석은 SPSS(version 14.0; SPSS Inc., Chicago, IL, USA)를 이용하였다.
결 과
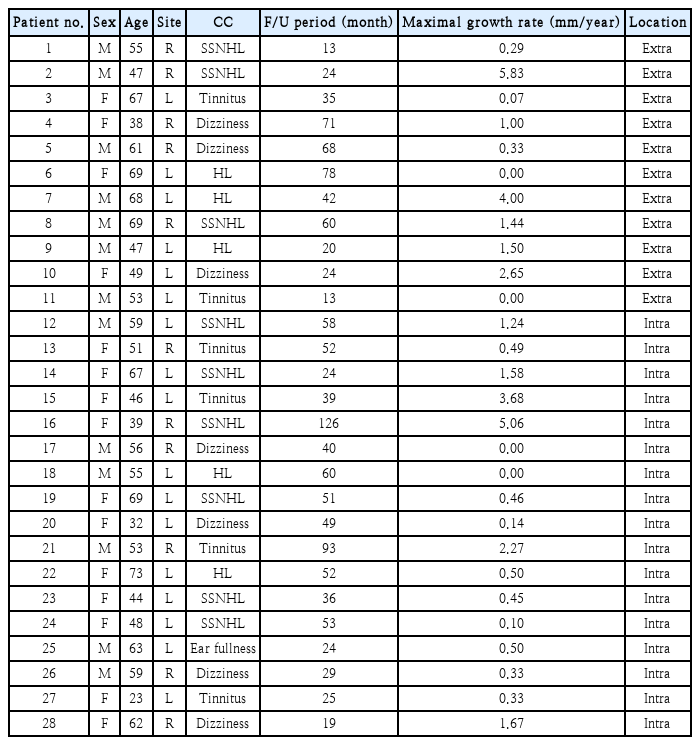
해당 기간 동안 전정신경초종으로 진단되어 추적 관찰을 시행한 환자는 총 28명으로 남녀 비율은 13:15로 비슷하였으며 환자군 연령은 23~73세까지 다양하게 분포하며 평균 연령은 54.4±12.3세였다. 종양의 위치는 좌측 17명, 우측 11명이었으며, 평균 추적 관찰 기간은 45.6±25.8개월이었다. 28명 중 청력 소실이 14명(50.0%)으로 가장 흔한 증상이었고, 그 중 돌발성 난청은 9명(32.1%)이었다. 14명의 청력 소실 환자 중, 이명을 함께 호소한 환자는 7명, 이명과 이 충만감을 함께 호소한 환자는 2명, 이명과 어지럼증을 함께 호소한 환자는 1명이었다. 이외 어지럼증만 호소한 환자는 7명(25.0%), 이명만 호소한 환자는 6명(21.4%), 그리고 이 충만감만 호소한 환자는 1명(3.6%)이었다. 추적 관찰을 하던 28명 중 종양이 성장했던 경우는 총 6명(21.4%)이었고, 6명 중 이후 수술적 치료를 진행했던 환자는 4명(66.7%), 정위적 방사선 수술을 받은 환자는 1명(16.7%)이었으며, 나머지 1명(16.7%)은 추가 치료 없이 추적 관찰하였다(Table 1, Fig. 1). 본 기관에서는 65세 이하에서 종양의 성장이 있었던 경우 위치와 관계없이 모두 수술을 시행하였고, 65세 이상에서 종양의 성장이 관찰된 경우 위치와 관계 없이 정위적 방사선 수술을 시행하였다. 이외의 모든 경우에서 종양의 성장이 관찰되지 않았을 경우 추적 관찰을 시행하였다. 다만, 두 군 모두에서 종양이 성장하였더라도 청력이 보존되었던 경우 우선 수술적 치료없이 추적 관찰을 유지하였고, 지속적인 성장이 관찰되었을 경우 65세 이하에서는 청력보존 수술을, 65세 이상의 고령 환자의 경우 정위적 방사선 수술을 권하였다.
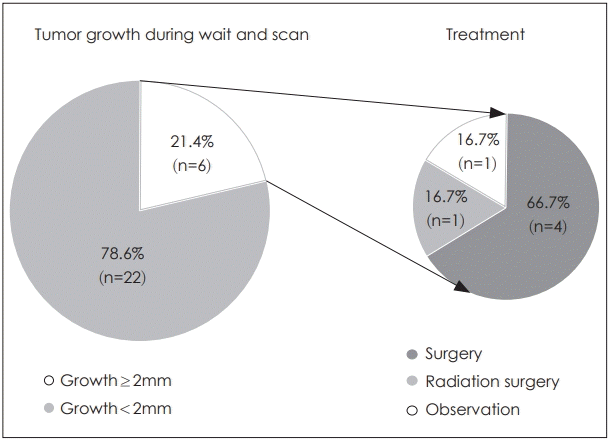
A comparison of tumor growth during wait and scan. Among the 28 patients, 6 (21.4%) showed tumor growth with size increase more than 2 mm in a year during wait and scan. Among them, 4 patients (66.7%) underwent microsurgery, 1 (16.7%) underwent radiation surgery, and 1 (16.7%) sustained conservative treatment.
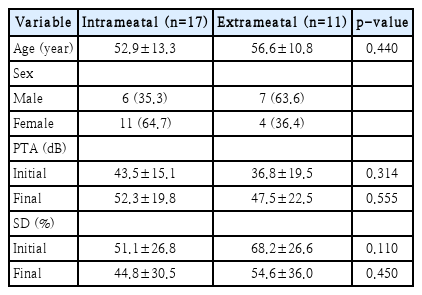
Intrameatal군은 17명, extrameatal군은 11명이었다. Intrameatal군의 경우 남성은 6 명, 여성은 11명이었고, extrameatal군에서는 남성 7명, 여성 4명이었다. 추적 관찰 전후 청력을 비교하였을 때 두 군 모두에서 추적 관찰 후 순음 청력과 어음명료도는 어느 정도 감소하는 소견을 보였으나 유의성은 관찰되지 않았다(Table 2). 종양의 성장 비율을 비교하였을 때, intrameatal군에서는 3명(17.6%), extrameatal군에서는 3 명(27.3%)에서 크기 변화가 관찰되었고, extrameatal군에서 더 높은 성장 비율을 보였으나 두 군 간 통계적으로 유의한 차이는 보이지 않았다(Fig. 2).
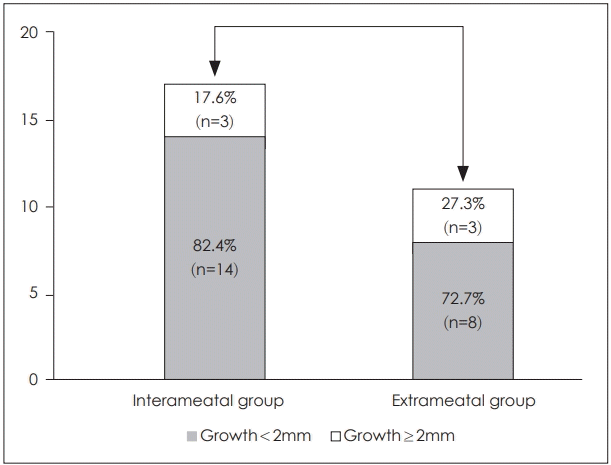
A comparison of tumor growth ratio between intrameatal and extrameatal group. Three patients (17.6%) and 3 patients (27.3%) showed tumor growth in an intrameatal and extrameatal group, respectively. There was no significant difference in tumor growth ratio according to the location of tumor (p-value was calculated by Fisher’s exact test. p=0.653).
전정신경초종이 있는 부위의 청력과 정상인 부위의 청력을 추적 관찰 전후로 비교하였다. 추적 관찰 전후 건측, 환측 모두에서 청력 저하가 관찰되었으며, 저음역대보다는 고음역대 주파수에서 청력 감소가 더 크게 관찰되었다. 그리고 모든 주파수에서 건측보다는 환측의 청력 저하 정도가 더 크게 나타남을 확인하였고, 이는 통계적으로 유의한 차이를 보였다(Fig. 3).
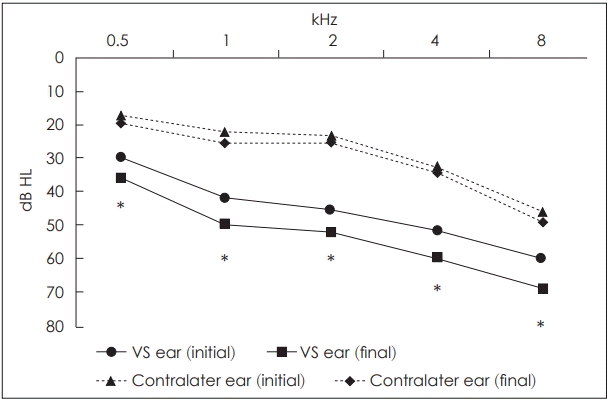
Mean audiogram of VS ear and contralateral ear at diagnosis (initial) and after wait and scan (final). Both PTAs of VS ear and contralateral ear decreased after wait and scan compared with those at diagnosis, but the degree of decrease in PTAS was more significant in VS ear than that in contralateral ear in every frequency (p-value was calculated by Student’s t-test. *p<0.05). VS: vestibular schwannoma, PTA: pure tone average.
5년 이상 장기간 추적 관찰한 환자들의 관찰 기간에 따른 청력 변화 그래프를 intrameatal군과 extrameatal군으로 나누어 비교하였다(Fig. 4). 총 7명의 환자 중 3명(16, 18, 21번 환자)은 intrameatal군, 4명(4, 5, 6, 8번 환자)은 extrameatal군에 해당하였으며, 추적 관찰 후 청력이 10 dB HL 이상 의미 있게 악화된 환자는 총 3명(8, 16, 21번 환자)이었다. 청력이 악화된 3명 중 종양의 성장이 관찰된 환자는 2명(16, 21번 환자)이었으며, 모두 intrameatal군이었다.
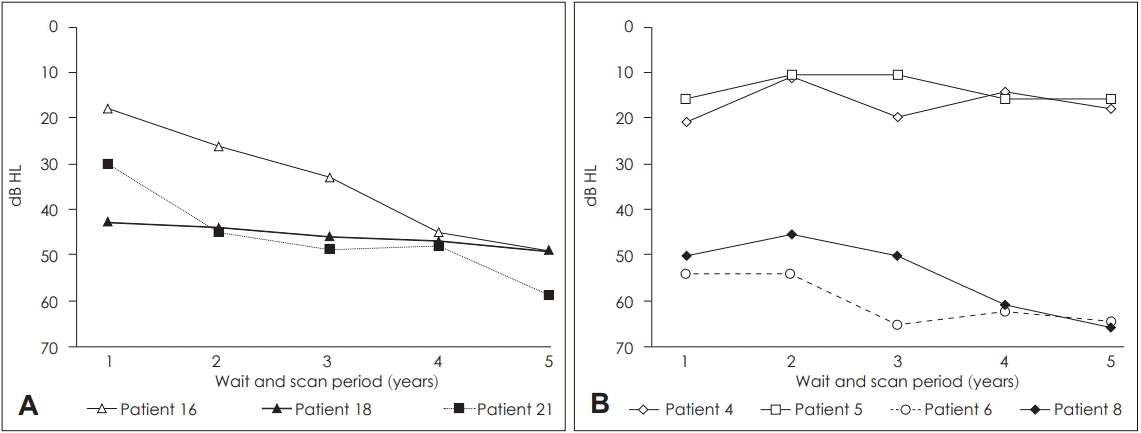
Changes in PTA during the first 5 years in patients with longer than 5 years of wait and scan in an intrameatal group (A) and extrameatal group (B). Total 7 patients were included; 3 (patient 16, 18, and 21) were in the intrameatal group, and 4 (patient 4, 5, 6, and 8) in the extrameatal group. Deterioration in the PTA more than 10 dB HL after wait and scan was observed in 3 patients (patient 8, 16, and 21). Among them, tumor growth was observed in 2 patients (patient 16 and 21), all of them belonging to the intrameatal group. PTA: pure tone average.
청력과 어음 명료도를 토대로 AAO-HNS 분류법에 따라 추적 관찰 전후를 A , B , C , D 군으로 분류하여 비교하였다(Fig. 5). 사회적응청력에 해당하는 A군과 B군은 진단 당시 12명에서 추적 관찰 후 9명으로, 75.0%의 환자에서 사회적 응청력이 보존됨을 확인하였다.
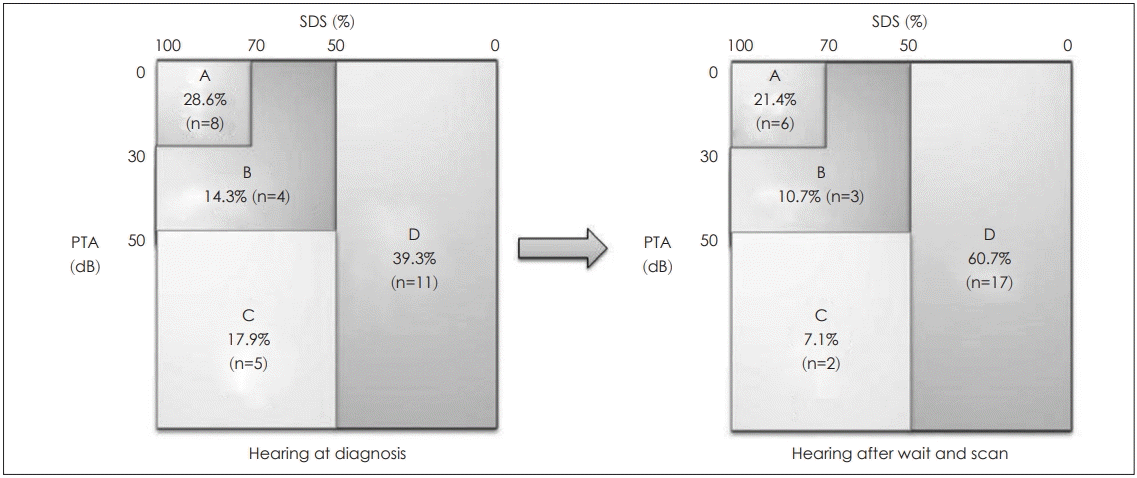
A comparison of hearing at diagnosis and hearing after wait and scan according to American Academy of Otolaryngology-Head and Neck Surgery classification. Classification A and B accounts for serviceable hearing. The number of patients showing preservation of serviceable hearing were 9 out of 12 (75.0%), which demonstrates the fact that majority of patients with vestibular schwannoma will preserve their hearing ability after wait and scan. PTA: pure tone audiometry, SDS: speech discrimination score.
청력 역치값과 어음 명료도값으로 격자 모양의 칸에 해당하는 환자수를 채워 넣는 방식의 산포도를 통해 진단 당시와 추적 관찰 전후의 변화 정도를 나타내었다(Fig. 6). 추적 관찰 전후 변화 정도를 나타낸 산포도에서 전후로 변화가 없었던 환자는 총 2명(7.1%)이었으며, 이외 나머지 환자들은 일반적으로 ‘변화 없음’ 근처에 해당하는 표의 중앙 부근에 고르게 분포해 있었다.
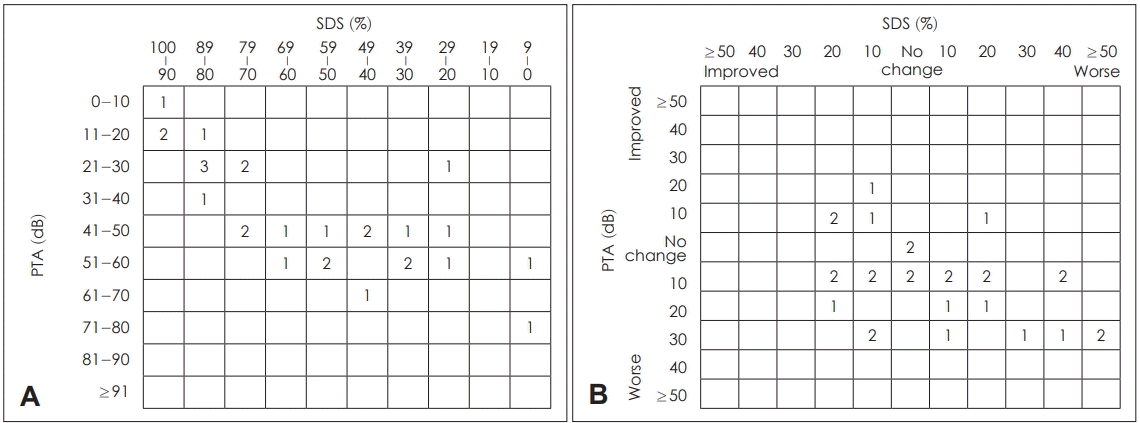
A scattergram of 28 patients at diagnosis (A), and a scattergram of 28 patients presenting the comparison between at diagnosis and after wait and scan (B) using PTA and SDS. In the scattergram B, most values are positioned near the center of the scattergram, meaning that the extent of changes in PTA and speech discrimination score is not large and that serviceable hearing is preserved in some degree after wait and scan. PTA: pure tone audiometry, SDS: speech discrimination score.
고 찰
전정신경초종으로 진단된 환자에게서 발생하는 가장 흔한 증상은 환측에서 발생하는 청력 저하이다. 전정신경초종의 크기가 점점 증가하여 내이도를 넘어 소뇌교각으로 진행할수록 평형감각장애(disequilibrium), 두통과 같은 중추성 증상까지 발생할 수 있다[9]. 이러한 중추성 증상들을 예방하기 위해서는 자기 공명 영상을 통해 전정신경초종에 대한 주기적인 추적 관찰이 필수적이며, 필요할 경우 적극적인 치료를 시행해야 한다.
전정신경초종의 치료에는 크게 미세 수술(microsurgery), 정위적 방사선 수술(stereotactic radiosurgery), 그리고 추적 관찰을 통한 보존적 치료가 있다. 미세 수술에는 경미로 접근법(translabyrinthine approach), 구불정맥굴뒤접근법(retrosigmoid approach), 중두개와접근법(middle cranial fossa approach) 등과 같은 여러 접근법이 존재한다. 일반적으로 뇌척수액 유출, 소뇌교각 부위 및 경막하 출혈과 혈종 등과 같은 다양한 수술 전후 합병증이 발생 가능하며, 경미로 접근법을 이용할 경우 수술법 자체만으로 청력에 심각한 저하를 발생시킬 수 있다[10,11]. 정위적 방사선 수술은 종양 표적화 정확도의 증가와 비침습성으로 인한 낮은 합병증 발생률 등으로 인해 전정신경초종의 치료에 많이 도입되고 있다[12]. 수술로 인한 합병증을 줄이고 정위적 방사선 수술의 재정적 부담을 덜 수 있는 점으로 인해 크기가 작은 전정신경초종에는 추적 관찰을 통한 보존적 치료를 시행할 수 있다[13,14].
일반적으로 새롭게 진단된 전정신경초종의 경우 3분의 1에서 크기가 증가하며, 대부분 5년 이내에 성장한다[15]. Agrawal 등[16]은 180명의 전정신경초종 환자를 대상으로 한 추적 관찰 연구에서 65명(37%)에서 종양의 성장을 관찰하였다고 보고하였다. 본 연구에서는 전체 28명의 환자 중 6명(21.4%)의 환자에서 종양의 성장이 확인되었고, 이는 적은 수의 환자들에서만 종양의 성장이 관찰된다는 기존 문헌의 결과와 유사하였다.
Strangerup 등[17]은 intrameatal군과 extrameatal군에서 종양의 크기 변화를 비교하였을 때 각각 230명 중 39명(17.0%), 322명 중 93명(28.9%)으로 종양의 성장이 extrameatal군에서 더 높은 것을 확인하였고, 종양의 성장을 보이는 환자의 비율을 주기적으로 조사하였을 때 각각 4년, 5년 뒤엔 종양의 성장이 멈춘다는 결과를 보고하였다. 본 연구에서도 통계적으로 유의하지는 않았지만 intrameatal군보다는 extrameatal군에서 종양의 크기 증가를 보이는 환자의 비율이 높게 확인되었다. 하지만 본 연구는 추적 관찰 기간이 아주 길지 않았기 때문에 성장이 언제 멈추는지는 확인할 수 없었다.
전정신경초종에서 시간이 지남에 따라 청력이 감소하는 정도는 환측이 정상 측에 비해 더 큰 것으로 알려져 있다[4]. 본 연구에서도 환측의 청력과 건측의 청력을 추적 관찰 전후로 비교하였을 때 기존 연구 결과와 마찬가지로 환측에서의 청력 소실의 정도가 더 유의하게 큰 것으로 확인되었다. 이러한 결과는 시간이 지남에 따라 발생하는 청력 저하보다는 종양 자체로 인한 청력의 악화 가능성으로 생각해볼 수 있다.
일반적으로 종양의 크기 증가 여부와 관련 없이 전정신경초종 환자에서 추적 관찰을 시행할 때 청력 감소의 가능성이 존재한다[18]. 이는 종양이 와우신경을 압박하는 효과보다는 생물학적인 전정신경초종 특성의 변화, 와우 혹은 와우신경으로 향하는 혈액 공급의 감소, 내이 림프액의 변화와 같은 기타 요인들로 인해 청력 저하가 발생한다고 생각되고 있다[19]. 본 연구에서는 5년 이상 장기간 추적 관찰 전후로 청력이 감소했던 환자 중 절반 이상에서 종양의 성장이 관찰되었다. 청력 저하와 관련하여 종양 이외 기타 요인의 여부를 확인하기 위해 더욱 정밀한 자기 공명 영상과 전문적인 판독이 필요하였으나 본 연구에서는 확인할 수 없었다. 이는 추후 새로운 정밀 영상 촬영 방법의 고안 및 전문적인 판독을 도입하여 검증해야할 것이다.
AAO-HNS 분류법에서는 순음 청력 검사와 어음 명료도를 통해 사회적응청력에 해당하는 A, B군과 그렇지 않은 C, D군으로 분류하였고, 이 분류법을 이용하여 Kirchmann 등[4]은 환자군을 추적 관찰 전후로 구분한 뒤 청력 변화를 도식화하였다. Stangerup 등[20]은 932명의 전정신경초종 환자를 조사하였을 때, 진단 당시 AAO-HNS 분류법에서 사회적응청력을 지닌 환자 455명 중 257명(56.5%)에서 추적 관찰 전후로 청력을 유지하였다고 보고하였다. 본 연구에서도 AAO-HNS 분류법을 적용하였을 때 75.0%에서 추적 관찰 후에도 사회적 응청력이 지속적으로 유지되었다. 이를 통해 추적 관찰을 시행했던 전정신경초종 환자들의 사회적응청력은 높은 비율로 보존된다는 것을 짐작할 수 있다.
전정신경초종 환자의 청력 변화를 쉽고 간편하게 비교할 수 있는 다른 방법으로 Jethanamest 등[8]에 의해 발표된 산포도를 이용한 추적 관찰 전후의 청력 비교 모델이 있다. 이는 청력 역치값과 어음 명료도값을 이용하여 격자 모양의 칸에 해당하는 환자 수를 채워 넣는 방식으로 청력 변화를 이전보다 간략하고 의미 있게 표시하는 방식이다. 마찬가지로 본 연구에서도 환자들의 청력 및 어음 명료도 수치를 진단 당시의 산포도와 추적 관찰 전후의 변화 정도를 비교한 산포도에 대입하였다. 그 결과 추적 관찰을 한 대다수의 환자들은 일반적으로 ‘변화 없음’에 해당하는 표의 중앙 부근에 고르게 분포해 있었다. 이는 추적 관찰 전후로 청력과 어음 명료도의 변화 정도가 크지 않고, 결과적으로 사회적응청력은 추적 관찰 전후로 어느 정도 보존됨을 알 수 있다.
종양의 성장과 청력 변화를 조사한 Walsh 등[18]은 AAOHNS 분류법 A군과 B군 환자 중 42%에서 청력 감소가 있으며 특히 종양이 성장한 군에서 청력이 감소한 비율(80%)이 종양이 성장하지 않은 군의 비율(14%)보다 높다고 보고하였다. 하지만 본 연구에서는 종양이 성장한 환자 6명 중 대부분인 5명은 진단 당시 사회적응청력이 아닌 C군과 D군이었으며, A군과 B군 환자에서 청력이 감소한 3명 모두에서 종양의 성장은 관찰되지 않았다. 따라서 본 연구에서는 종양의 성장과 청력의 상관성은 낮을 것으로 보았고 이는 기존의 Lee 등[14]의 논문과 일치한다.
결론적으로 제한적인 종양의 성장 및 청력 변화를 고려하였을 때, 본 연구는 새롭게 진단된 작은 크기의 전정신경초종 환자들에 대해 추적 관찰을 시행하는 것은 충분히 선택할 수 있는 치료 대안으로 생각한다. 하지만 본 연구는 표본대상자의 수를 충분히 확보하지 못해 정확한 결과가 도출되지 못했을 수 있고, 이는 추후 다기관 연구(multi-center study)를 통해 증례 수를 늘려 추가적인 검증을 해야 할 것이다.
Acknowledgements
None.

